Is it Wi-Fi,
your ISP
or the Internet?
Latency, bandwidth, network config and device performance in a terminal app with a built-in dashboard and analysis to help diagnose the data.
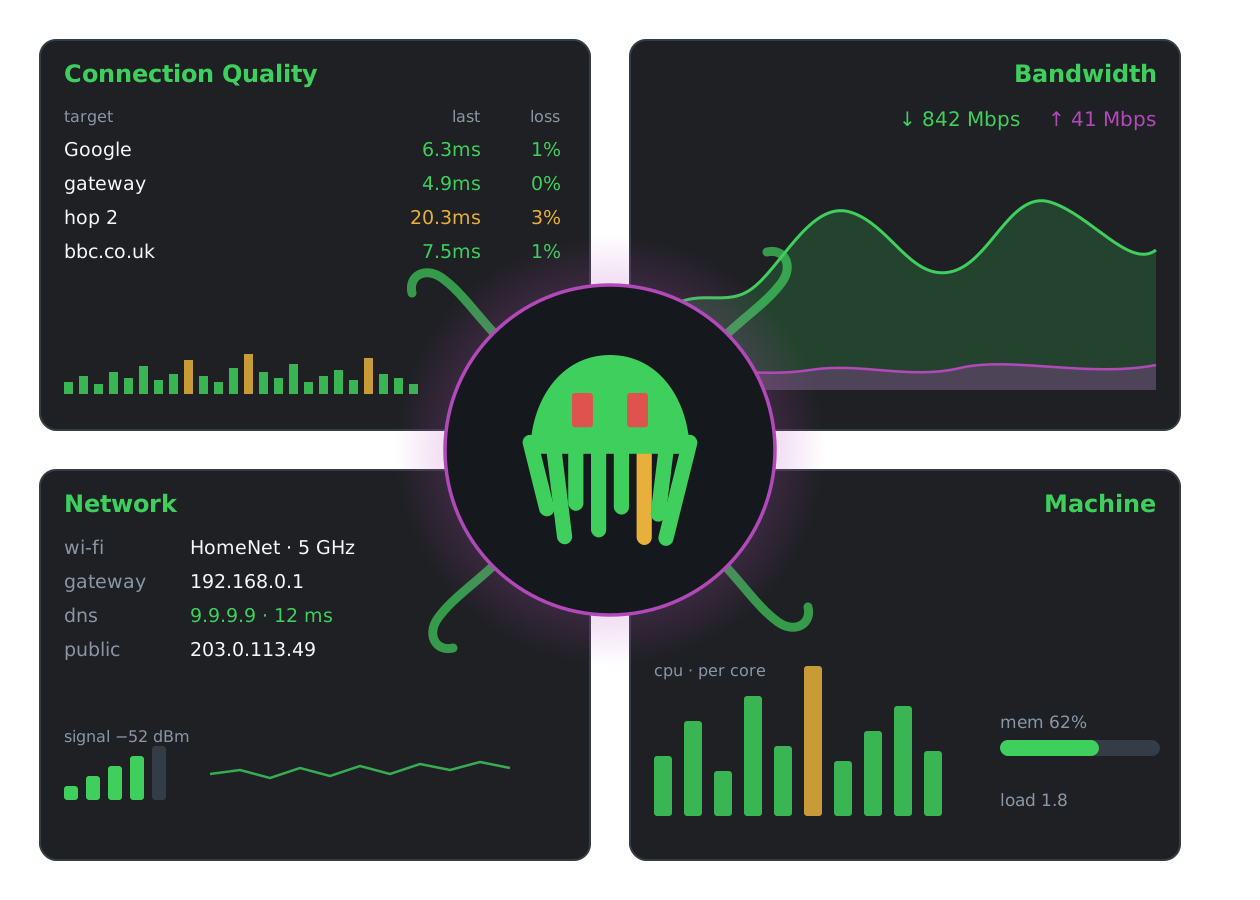
…in other words, “what the F&#K is going on with my Internet?”
Install
homebrew · macOS
brew tap securitypedant/octomonbrew trust securitypedant/octomonbrew install octomonapt · Debian & Ubuntu
curl -fsSL https://octomon.dev/apt/octomon.gpg | sudo tee /usr/share/keyrings/octomon.gpg >/dev/nullecho "deb [signed-by=/usr/share/keyrings/octomon.gpg] https://octomon.dev/apt stable main" | sudo tee /etc/apt/sources.list.d/octomon.listsudo apt update && sudo apt install octomonamd64 and arm64. Signed; the first line installs the key.
winget · Windows
winget install SimonThorpe.Octomonx64 and ARM64, code-signed: free code signing provided by SignPath.io, certificate by SignPath Foundation (our signing policy). No winget? There is a PowerShell installer, and zips are on GitHub releases.
cargo · anywhere
cargo install octomonBuilds from source; needs Rust 1.88+.
Four panels, one analysis
Detailed information on each aspect of your Internet connection, with a single, easy to understand summary. ▲ gateway unresponsive or ● connection healthy. Full analysis explanation y: showing each network subsystem from your machine to the Internet.

Connection Quality
ICMP latency to your targets, last / avg / p95 / max, jitter, loss, a bufferbloat grade. The gateway and first ISP hops are auto-discovered. Traceroute any target with t, monitor every hop MTR-style with m, and a whois lookup for an address with W.

Bandwidth
Live throughput and an on-demand speed test (s, Cloudflare / M-Lab / LibreSpeed / your own iPerf3 servers), with the traffic attributed: top talkers by process or by remote address (n), session totals, retransmits.

Network
How you're attached: interface, Wi-Fi / Ethernet / VPN, addresses, gateway, DHCP server, public IP, and every resolver timed. Checks against a public reference, Wi-Fi signal and airspace congestion graphed, and a dated history of every join, roam and address change.

Machine
"Is my device the bottleneck?" CPU with the busiest core, memory pressure, load, interface errors, thermal throttling. A busy machine is reported as a caveat beside a network fault, never as a way to hide one.

…and the analysis on top of the data
Press y and octomon shows its work: the triage ladder from your machine outward, the background checks (captive portal, clock, path MTU, NAT, DNS honesty), this network's learned normal and incident history, and the findings with their evidence. D zips it all into a support bundle; --doctor prints a redacted report safe to paste into an ISP ticket.

Watch the tour
Now, versus normal
octomon is not an observability platform, and it doesn't want weeks of your network data. It answers one question: how is my connection right now, and is that normal for where I'm sitting?
Each target gets an ICMP probe every second. The w window (30s to 15m) sets how many of those outcomes the table summarises, and every cell grades itself over that window: the name and last columns display the current condition while avg, p95, max, jitter (RFC 3550 interarrival) and loss carry the history. A recovered path visibly greens from the left as the incident drains out, with a ↓ on loss that is history rather than happening.
Underneath, each network is fingerprinted on SSID plus gateway MAC, so DHCP renewals and mesh roams keep one identity and the same LAN over copper and over radio count as two different normals. What normal means is learned as slow EWMAs (exponentially weighted moving average) folded once per clean minute: latency to your gateway and to the best remote address (typical and p95), resolver response time, Wi-Fi signal strength, and crucially how much ICMP loss is usual there. A minute tainted by an active network issue never teaches the baseline; a degraded state that stands long enough is reclassified as that location's weather and does. Comparisons stay silent until five minutes have been learned, and the baseline persists across runs, so a session that starts broken is still judged against what this network can (or cannot) do.
The grading is relative with absolute floors: latency within 1.5x of the path's floor is fine and beyond 3x is bad, loss within 1.5x of the learned normal is fine, with office-LAN absolutes as the fallback when nothing has been learned yet. That's what keeps plane Wi-Fi honest. It drops 20 to 40% of ICMP as permanent weather (control-plane deprioritisation, not path failure) while TCP still flows, which octomon proves by making small web requests, over both IPv4 and IPv6 (when available), to confirm actual traffic still gets through. So instead of a wall of red and a false outage, one line: ▲ connection degraded but usable, web traffic still getting through.
Hotel Wi-Fi is the mirror case: fine at noon, congested every evening. While a latency problem is active, the latency numbers are left out of the learning, so the 9pm inflation never redefines what normal means, and the analysis can say gateway 41ms vs ~9ms normal here and name the network as the culprit. Findings themselves pass hysteresis (raise on 4 of the last 6 evaluations, clear only after a quiet stretch), so one lost packet never flaps the verdict. And the past isn't the live table's job: the events timeline e and each location's incident history keep what happened an hour ago, with timestamps and durations, so the windows can stay short and honest.
It's not DNS.
There's no way it's DNS.
It was DNS.
a haiku, traditional among people who run the internet
(author unknown, like most root causes)
octomon times every resolver you use, checks their honesty against a public reference, and names local DNS outages, so when it is DNS, you'll know in one line.